Today's Fertilizer Market Is Like a Game of Jenga: Part Two- Domestic Factors
This is part two of a weekly, four-part series from LebanonTurf on the current state and forecast of the turf and ornamental fertilizer market.
Part Two – Domestic Factors
As we move into discussing the multiple domestic factors that are impacting today’s fertilizer market, it’s important to understand that these “Jenga pieces” are very much interlocked with the numerous global factors that will be covered in the next section. Virtually everything that is happening within our nation’s borders is also happening, to some degree, in every other country as well. While I’ll be focusing on homegrown issues in this section, there undoubtedly will be references to specific foreign countries where appropriate. These references are unavoidable and quite vital to understanding why we are in our current situation.
Remembering The Great Recession of 2008
If our current situation induces a little bit of déjà vu, then you likely remember that we’ve been down this unfortunate road before, in a time that history books refer to as “The Great Recession”.
The Great Recession was the sharp decline in economic activity during the late 2000s. It’s considered the most significant downturn since the Great Depression and applies to both the U.S. recession, officially lasting from December 2007 to June 2009, and the ensuing global recession in 2009. During this time, the fertilizer markets behaved very similarly to what they’re currently doing for many of the same reasons.
Prices were essentially driven up by an imbalance between supply and rapidly expanding demand. Fertilizer demand reached a level that supply simply could not match. Demand was particularly strong in China and India due to fears of inadequate food supply for their people. Another factor was increased demand to produce additional corn and other crops for biofuel production in the U.S., Europe and Brazil. Increased livestock production created additional, unanticipated demand for grain. As a result, grain reserves became historically low and prices quickly rose.
Further worsening the situation was China’s imposition of high tariffs on fertilizer exports and the devaluation of the U.S. dollar in 2007 and 2008. Energy prices peaked, causing an increase in the price of natural gas. Phosphate prices were driven up by a huge increase in demand for sulfur, which is vital for DAP production and phosphate fertilizers. Finally, the supply of quality rock phosphate became incredibly tight.
The only good news about this time in history is that it was short-lived, as the fertilizer markets took a nosedive in late 2008 due to demand destruction. Farmers were either unable or unwilling to pay two or three times the prices of early 2007, which instantly decreased overall fertilizer demand. When this first domino fell it caused an immediate decline in global agricultural trade, which then lead to a trade recession and a slowdown in world economic growth. Fertilizer manufacturers cut back on production and commodity prices began to return to “normal” pricing levels.
Ultimately, it was the farmers that played the largest factor in surviving the fertilizer market madness in the late 2000s. As one of the largest and most important players in this Jenga fertilizer game, their decision to not play at all had the most significant impact. How important are they in today’s game?
Agricultural Farming
Previously, we’ve flippantly referred to this segment as “Mother Ag”, due to their overwhelming dominance over our little T&O market. However, it’s an extremely accurate analogy with respect to not only all-things fertilizer related, but also pesticides, nutrient technology advances, biostimulant use and pretty much everything else we use on today’s turfgrass. Without “Mother Ag” paving the way by researching and developing new technologies for their crops, and footing the extremely large costs along the way, it’s guaranteed that we wouldn’t have so many effective weapons in our T&O arsenal for turfgrass.
As the old adage goes, it’s all about size…and it doesn’t get any bigger than agriculture. To put this into proper perspective, agriculture consumes about 24 million tons of nutrients per year, while T&O consumes around 35 thousand tons. They literally consume a thousand times more nutrients than we do. Which makes sense considering the U.S. is among the most productive agricultural producers in the world, accounting for about half of the world’s entire corn supply. And this is where the Jenga tower starts to wobble.
Corn is the most widely planted crop in the U.S. and the largest user of nitrogen in terms of application rates per acre, total acres treated and total applications. Last year, U.S. farmers planted and grew 92 million acres of corn…all of which consumed copious amounts of fertilizer. During its life cycle, corn removes one pound of nitrogen for every bushel of grain produced, so a 200 bushel per acre yield goal requires 200 pounds of nitrogen available to be used in growing the corn plants. This explains why fertilizer accounts for 36% of a farmer’s operating costs. To their credit, however, and as a testament to their commitment to research and development efforts, the United States’ share of global fertilizer demand has dropped from 20% to 10% over the past 15 years.
Keep in mind that the price of nitrogen for farmers is only one part of the ever-important equation that dictates if, and how much, fertilizer they apply. The other equally crucial piece is the selling price. The price for a bushel of corn must be high enough for the farmers to justify buying and applying the nitrogen to maximize yields and achieve reasonable profit margins. In the end, it really comes down to a simple equation of return on investment. When the price of a pound of fertilizer exceeds the expected increase in revenue from spreading it on the field, it is not profitable to use that pound. When this happens, the farmers simply won’t buy it…. just like they didn’t back in 2008.
Currently, the projected 2023 price for corn, per bushel, is $6.15 with a break-even price being forecasted at $5.00. Both predictions are relatively strong and would suggest that the farmers would still likely be looking to maximize yields by applying nitrogen. With some recent softening in the market, farmers could decide to roll the dice by splitting nitrogen applications in a risky attempt to take advantage of potential further price reductions later in the spring.
Another risk management strategy that farmers may choose to employ, is to pivot their acres away from corn and instead plant soybeans or wheat. Soybeans require less fertilizer because they have a natural nitrogen fixing capability. In 2022, approximately 87.5 million acres of soybeans were planted and grown. By converting acres away from corn and changing the mixture of crops planted, farmers may be able to mitigate their exposure to high fertilizer prices. If this approach becomes widespread, the overall demand for nitrogen will be considerably reduced for 2023.
The full impact of rising fertilizer costs will hit farmers much harder in 2023 than it did in 2022. Because farmers are skillful planners, a great many of them were not harshly impacted by the sudden spike in the fertilizer market in early 2022. Many farmers had already purchased their fertilizer back in late 2021 at a much lower cost than those who purchased in the spring of 2022. This strategy proved very beneficial for market stability in early 2022, but it’s not something that will be happening again this year. Presently, farmers are pondering if, and when, they are going to buy nitrogen for their 2023 crop, which will directly impact the market in terms of overall demand.
As agriculture contemplates how they are going to deal with the upcoming season, there are two key indicators to keep an eye on which will directly affect the price of T&O fertilizer.
- The number of acres of corn and soybeans planted.
- 2022 acres: Corn 92 million and Soybeans 87.5 million
- Look for sizable shifts from 2022 acres.
- More corn means more nitrogen will be bought = more overall demand.
- More soybeans mean less nitrogen will be bought = less overall demand.
- The price of corn per bushel.
- Projected price of $6.15.
- If price rises, more nitrogen will be bought by the farmers = more overall demand.
- If price lowers, less nitrogen will be bought by farmers = less overall demand.
Just like in 2008, the farmers are the major players that will decide what the supply and demand model will look like in 2023. Since the T&O market is near the bottom of the fertilizer ladder, we’re very much at the mercy of whatever the emerging paradigm ends up being.
Domestic Nutrient Production
Everywhere you go these days, you can see all the slogan signs of “Buy Local”. When the fertilizer market initially started spiking and all the international factors started grabbing the headlines, questions regarding our country’s dependence on foreign suppliers took center stage. At each industry partner event we were asked to present a fertilizer market update at, we were typically asked about domestic nutrient production and how much we relied on international suppliers. Let’s look at this specific Jenga piece and how it currently is sitting in the tower.
The United States is heavily self-sufficient in producing and providing our entire country’s nutrient needs…at least where it can be. We produce approximately 85% of all the nitrogen fertilizer we use and 90% of the phosphate fertilizer, but only 10% of the potash fertilizer. Most potassium-based fertilizers are imported from Canada. Overall, the U.S. only imports 20% of all of our fertilizer, which accounts for only 10% of the global fertilizer market. Unfortunately, the 20% that we do import is likely to keep fertilizer prices elevated due to global shortages.
Ammonia (Urea) Production
We’re going to be referencing ammonia production in this section and not urea specifically. For the purposes of this article, it’s appropriate to consider them the same, even though they are, in fact, different. Both ammonia and urea are nitrogen-containing compounds that are produced in the same facility. Ammonia is the simplest nitrogen containing compound, whereas urea is a derivative of ammonia. However, since “Mother Ag’ utilizes both ammonia (as UAN) and urea, the combination of their production collectively impacts our T&O market.
Ammonia is produced at 32 plants in 17 states and shipped around the country by pipeline, rail, barge, and truck. In 2018, the U.S. ranked second in ammonia production, representing 12% of global production. 56% of domestic ammonia production is in Texas, Louisiana, and Oklahoma, where large natural reserves of shale gas are available to power the facilities. U.S. ammonia production has been increasing since 2015, rising 46% from 11.6 million metric tons per year to 17.0 million metric tons per year in 2020. With growth in domestic crop production outpacing the growth in demand, U.S. reliance on imported ammonia has decreased from 40% in 2010 to only 13% in 2020. However, when it comes to global exports, the U.S. is not a major fertilizer exporter, as we hold a 4.6% share of ammonia exports, ranking 7th overall.
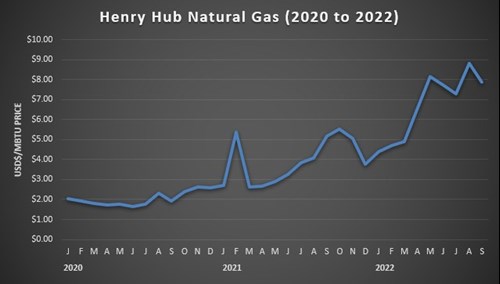
Heading into 2021, our domestic supply of ammonia was sufficient, until Mother Nature threw massive amounts of weather-related curve balls that disrupted the U.S. supply chain of ammonia production. In February 2021, extremely cold weather in Texas shifted away much of the natural gas used for ammonia production and diverted it to the Lone Star state for heating purposes. This shift removed about 250,000 tons of production out of the schedule. Once that humanitarian crisis was averted, Hurricane Ida came sweeping in and hit the same areas, causing additional production shutdowns. The extreme weather not only directly impacted ammonia production, but it also disrupted natural gas production. This limited production spiked the price of natural gas from $2.71 per 1,000 cubic feet in June 2020 to $9.33 in February 2021. Natural gas prices remained above $4.00 per 1,000 cubic feet throughout 2021 and into 2022. Additionally, because the COVID pandemic delayed much-needed plant maintenance, which resulted in slower and less efficient production, the supply problem worsened.
Since that time, U.S. ammonia plants have been reeling from continued, high domestic natural gas prices and are struggling to remain profitable. Some of the 32 ammonia plants have significantly reduced their production output due to these higher natural gas prices. This is very similar to what we reported in the part of the series with regards to ammonia plants throughout Europe.
To better illustrate the current trend of domestic natural gas prices, you simply need to see the historic spot pricing of the Henry Hub pipeline in Erath, Louisiana, that serves as the official delivery location for futures contracts on the New York Mercantile Exchange (NYMEX).
Domestic ammonia production is the anchor for our entire country’s nitrogen needs. Recent setbacks have added to already shaky supply chains and helped drive up fertilizer market prices. Until natural gas prices subside, and our domestic ammonia plants return to optimal production rates, there’s very little evidence that all ammonia nitrogen products will return to normal pricing levels.
Diammonium Phosphate (DAP) Production
Diammonium Phosphate is the world’s most widely used phosphorus component for both agricultural row crops and T&O applications. Fortunately, we’ve currently been able to meet approximately 90% of our market demand with domestic suppliers, despite a steady decline in overall production volume due to shrinking sedimentary deposits around the country. Despite the dwindling amount of viable ore deposits, 22 million tons of DAP was produced and available for commerce in 2021.
The size of the domestic phosphate manufacturing market is somewhat modest, with only five companies mining the phosphate rock ore at a total of 10 mines spread throughout four states. Florida and North Carolina accounted for more than 75% of total domestic output, while the remainder was produced in Idaho and Utah. More than 95% of the phosphate rock mined in these four states was used to manufacture wet-process phosphoric acid and superphosphoric acid, which are used as intermediate feedstocks in the manufacturing of granular and liquid ammonium phosphate fertilizers…or put more simply, the DAP component we use in our fertilizer products.
In 2021, domestic demand of phosphate rock was estimated to be roughly the same as it was in 2020. However, both DAP and MAP experienced domestic production shortfalls. Multiple phosphate facilities in Louisiana were severely damaged from Hurricane Ida in August, while the largest phosphate facility in Florida had unexpected technical problems. Both incidents, combined, forced the U.S. to increase the amount of DAP being imported to 1.4 million tons, an increase of 60% over 2020.
Two years ago, DAP was selling for $360 a ton, whereas now it sits at around $740 a ton. Over that time, prices for phosphate fertilizers were driven up by several supply-related factors, including new U.S. import taxes, strong agricultural grower outlook and China’s suspensions of exporting phosphates
In March of 2021, the U.S. International Trade Commission ruled that the domestic phosphate industry was being “materially injured by reason of imports of phosphate fertilizers from Morocco and Russia that the U.S. Department of Commerce has determined are subsidized by the governments of those countries.” With this ruling, U.S. authorities imposed a 20% import tax for Moroccan phosphate and duties ranging from 10% to 45% on Russian phosphate imports. In essence, the government was protecting domestic phosphate production. The impact, however, pushed global prices even higher.
With continued elevated crop prices, farmers started buying up phosphates to maximize yields and capitalize on the market. As a result, more acres were planted and fertilized than what would have been in a typical year. This unforeseen factor further tightened supply, which of course drove even greater price rates.
Another factor that weighed on phosphate market pricing was China’s decision to suspend all phosphate exports until June of 2022. The speculation has been that China halted these exports to build domestic stockpiles to ensure future food supply. As the top-producing country, China puts out 90 million metric tons annually, which accounts for 30% of global supply. Such a drastic removal of available supply helped maintain the higher-than-normal phosphate market pricing.
Most of the supply side reasons contributing to the initial rise and continuance of DAP market prices still exist today. Since agriculture has no substitute for phosphate, the demand is only going to continue to grow. There’s no reason to think that DAP prices are going to be returning to normal levels for the 2023 season.
Muriate of Potash (MOP) Production
As we’ve seen, the U.S. is a significant producer of nitrogen and phosphate, which allows us some control over how we manage much of our annual needs. Unfortunately, that’s not the case when it comes to potassium. The U.S. has very limited production of potash, primarily because we simply do not have an abundance of potassium mineral deposits within our borders. What little amount that we do produce is limited to four companies operating six different mines. Most of the U.S. production is in southeastern New Mexico, where two underground mines and one deep-well solution mine are operated. The remaining three facilities are in Utah utilizing similar manufacturing processes. In 2021, these six mines produced approximately 480,000 tons of potash.
A new large-scale potash mine has been in development for several years in Osceola County, Michigan. The proposed solution mine would have an initial production capacity of 650,000 tons of MOP per year, with plans to ramp up to 1 million tons per year. If realized, this mine would become the country’s largest potash facility and more than double the domestic production of potash. In September, the Michigan Strategic Fund began the initial steps of approving a $225 million bond for the parent company. This additional domestic production would make a significant impact in helping us supply our annual consumption of approximately 8.3 million tons of potassium potash, which we currently only cover with 6% of domestic supply.
With such a large gap, we are deeply dependent on importing potash from other countries. Last year, the U.S. imported 7.8 million tons of potash, which accounted for 94% of our total consumption. Being this heavily reliant on other countries for potash, by its very nature, is disconcerting and one of the major reasons why we saw price increases over the past two years.
Globally speaking, potassium production is the most concentrated. There are three countries that produce approximately 50% of the world’s supply of potash: Canada, Russia, and Belarus. Canada is the world’s leading producer with exports of over 24 million tons, which accounts for 32% of the global supply. Russia and Belarus both supply around 14 million tons each, 18% of the global supply. Since virtually all crop production uses potassium, every other country relies on these three countries for their needs, which is where the root cause of our current issue lies.
Due to its limited supply base, potash is highly vulnerable to disruptions. In the spring of 2021, when increased and unexpected, agricultural demand started pulling more tons to the U.S., the market price reacted due to perceived fears of less overall tons being available for the rest of the world. With strong U.S. crop prices supporting the application of MOP, this demand continued to grow…as did the market price. However, this was only the beginning of far worse market disruptions.
On February 24, 2022, Russia invaded Ukraine, which instantly destabilized multiple fertilizer markets due to the uncertainty of how it would impact future commerce. Many countries, including the U.S., imposed harsh economic sanctions on Russia, however fertilizer wasn’t one of them. Nonetheless, with so many unknown factors involved with how Russia would be managing their exports at a time when they need capital to continue funding the invasion, fertilizer markets continued to see price increases.
Belarus’ largest potash producer, Belaruskali, is a state-owned company. Back in 2020, the U.S. placed sanctions against them due to their fraudulent presidential elections. The most detrimental sanction went into effect on April 1, 2022, which was the deadline for all U.S. companies to end any business dealing with Belaruskali. This action further limited the available supply of MOP for the U.S.
Of all fertilizer commodities, potassium-based components are the most susceptible and also pose the most risk to, the overall consumption needs of the U.S. While increased domestic production capacity will result in a slight reduction in import penetration, the U.S. will remain principally dependent on imports to satisfy domestic demand. Foreign dependence is unlikely to ever be fully dissolved with such high levels of domestic demand and a limited number of domestic resource deposits and producers. In short, we are at the mercy of the global market when it comes to potassium MOP.
Final Thoughts
After looking at these domestic factors, we run the gambit in terms of what level of control we have over each specific component. In some instances, increasing domestic production is a viable option to help control prices. In others, it’s quite impossible. Fertilizer is a global commodity; it can be influenced by various market factors that are far beyond the control of U.S. producers. Whether we like it or not, the U.S. isn’t always the main Jenga piece in the tower. But we’re always a player in the game, to one extent or the other. Or at least until such a time that not playing it makes more sense…like the farmers did back in 2008.
In the third part of this series, we’ll dive into some of the various international factors that will continue to shape what the fertilizer market will look like in 2023.